

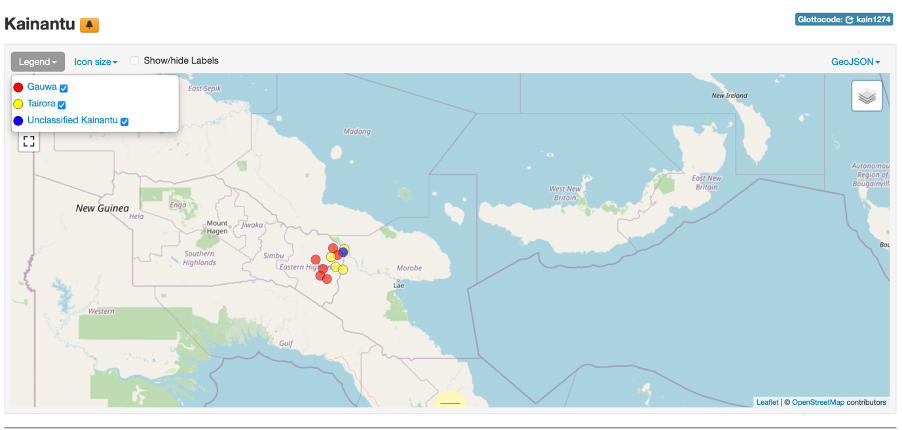
Leaflet (https://leafletjs.com) is a JavaScript library for adding interactive maps to websites. It is an alternative to Google Maps, and while requiring more effort to set and use, it can give the designer more control over the resulting website. Leaflet is used by sites such as Glottolog (https://glottolog.org) and the J. Paul Getty Museum (https://www.getty.edu/publications/romanmosaics/).
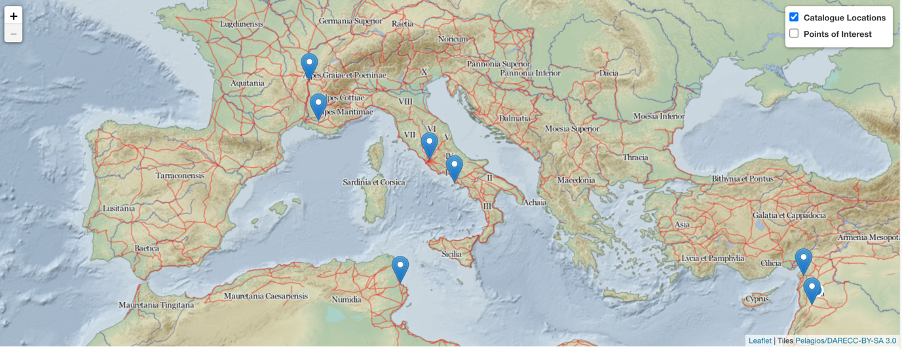
Leaflet does not ‘contain’ any actual geographical data, it allows access to map tiles from sources such as OpenStreetMap (https://www.openstreetmap.org/about), MapBox (https://www.mapbox.com) and Stamen (http://maps.stamen.com). These sources sometimes require an API key (access token), which is incorporated into the frontend JavaScript code, to allow the website users access.
The tutorials and examples at https://leafletjs.com, allow a user with minimal JavaScript experience, to relatively easily, create an interactive map with multiple layers, custom markers and pop-ups or tooltips. However, adding features, such as a JavaScript variable that changes in response to marker selection, can be challenging. Often Leaflet code snippets used to answer queries that developers have posted on the web, no longer produce a functional map, or are difficult to understand for those with less JavaScript experience. Code maintenance issues can result from version changes, browser compatibility or the map tile source.
While there are additional libraries, or methods, that help integrate Leaflet into JavaScript frameworks such as React (https://react-leaflet.js.org), it can be difficult to use with some libraries/frameworks. However, the many community-developed plug-ins are a strength of Leaflet.
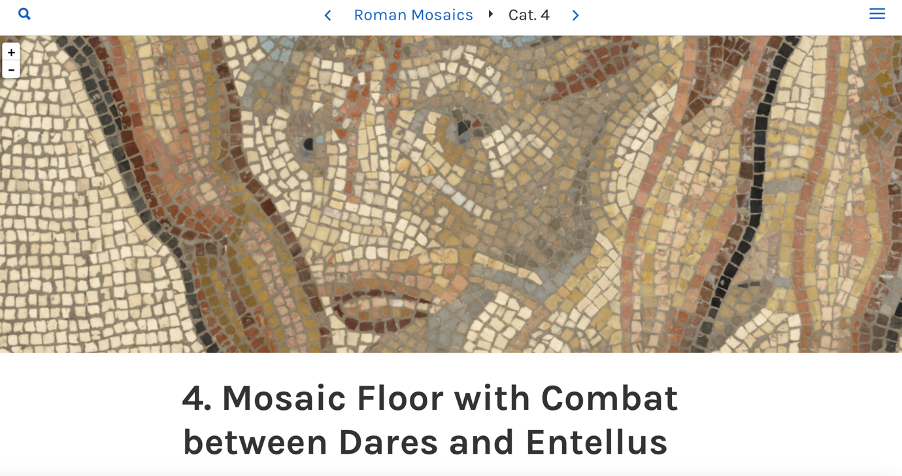
Leaflet could also be used to interactively present maps of historical or imaginary places, if a tile source or even a single image, is available. The tiled images could also be non-geographical, such as mosaics (or other art-works) or microscopy slides , where having a zoomable interface with optional annotation overlays was desirable. A combination of Leaflet with tiles made by Zoomify, has been used by the WA Museum website to show collections, such as its Beetle database (https://museum.wa.gov.au/explore/blogs/morgan-strong/zoomify-html5-update-leaflet-viewer), online and it has been used to make a virtual microscope page by the Center for Research in Biological Systems (http://www.cellimagelibrary.org/home). There is also a leaflet plugin for the iiif format which means that paintings with an iiif manifest can be used in interactive painting critiques (https://the-drawing-lesson.glitch.me).

Creating an event listener to change a variable (for the JavaScript beginner).
One thing a beginner may struggle with when creating a Leaflet map is changing a variable is response to marker selection. While pop-ups and tooltips can provide information about a selection, it may be that the web site creator wants to use the map as a way for the viewer to select a site for further investigation.
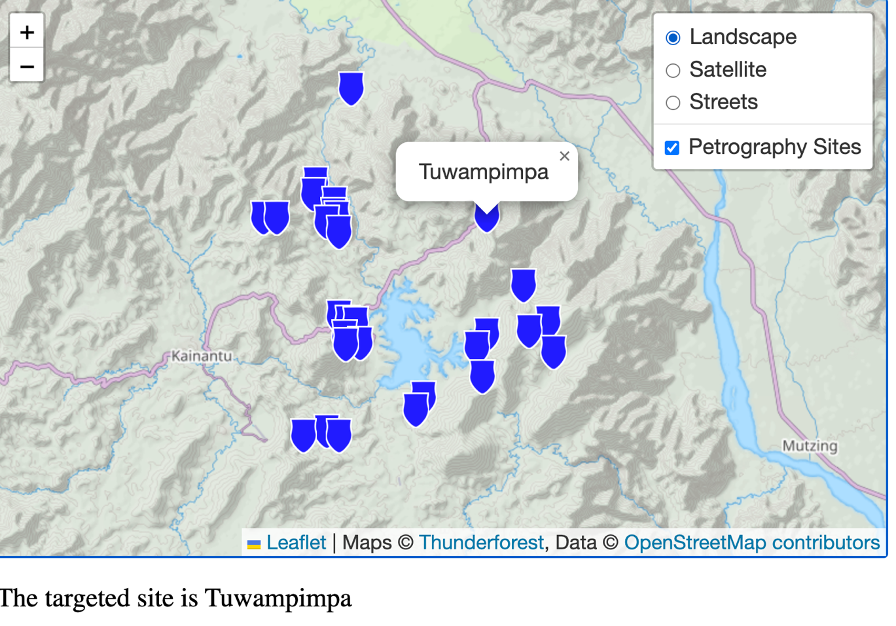
In this code extract in the <script> siteNames is an array of site names, siteLat an array of the site latitudes, siteLng and array of the site longitudes and sites a featureGroup of the sites, that will be a layer. The site markers were added in a for loop using the arrayed latitudes, longitudes and names. Note that the site names were added under the title property, but other properties can be created and used. When each marker is being created and added to the site featureGroup, the .on() event listener is used. This listener uses the “click” event to trigger the markerOnClick function, which gets passed the triggering event. The markerOnClick function is defined by the developer. Here the targetSite variable is changed to this.options.title, where title is the marker property of interest.
var targetSite = siteNames[0];
let sites = L.featureGroup();
var marker, sitename;
for (var i = 0; i < 29; i += 1) {
    sitename = siteNames[i];
    marker = L.marker([siteLat[i],siteLng[i]],{icon: potIcon, title: sitename}).bindPopup(sitename).on("click", markerOnClick).addTo(sites);
}
let overlays = {
    'Petrography Sites': sites
};
var layerControl = L.control.layers(baseLayers, overlays).addTo(map);


function markerOnClick(e) {
    targetSite = this.options.title;
    document.getElementById("targetSite").innerHTML = "The targeted site is " + targetSite;
}